
In Odoo, views play a major role in determining how records are displayed to users. Several views enhance the usability for developers and other users.
In this blog, we will explore the various views in Odoo 18
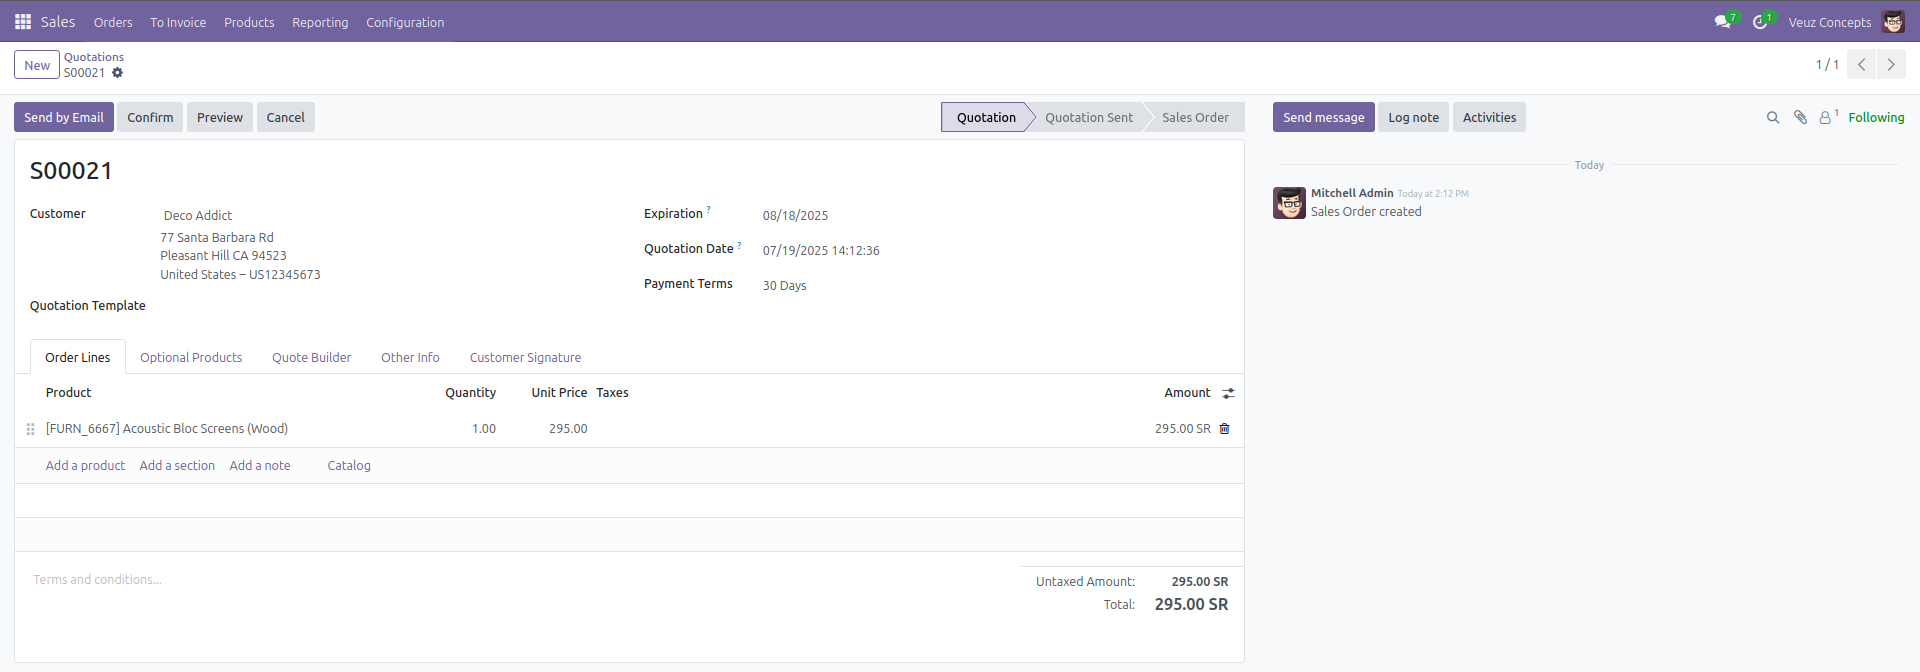
Form View
The form view is used to display detailed information about a specific record. It allows users to create or edit a record. This view is defined using the <form> tag.
Here is an example code of how to define a form view :
<odoo>
  <record id="view_form_library_book" model="ir.ui.view">
    <field name="name">library.book.form</field>
    <field name="model">library.book</field>
    <field name="arch" type="xml">
      <form string="Book">
        <sheet>
          <group>
            <field name="name"/>
            <field name="author"/>
            <field name="published_date"/>
            <field name="category_id"/>
          </group>
        </sheet>
      </form>
    </field>
  </record>
</odoo>
- Model : It operates in the library.book model
- Name : an internal name of the view (for developers to identify).
- Form view is defined using the <form> </form> tag
- string="Book" sets the form title shown at the top.
- Sheet : main content area inside the form.
- Group : arranges fields into columns.
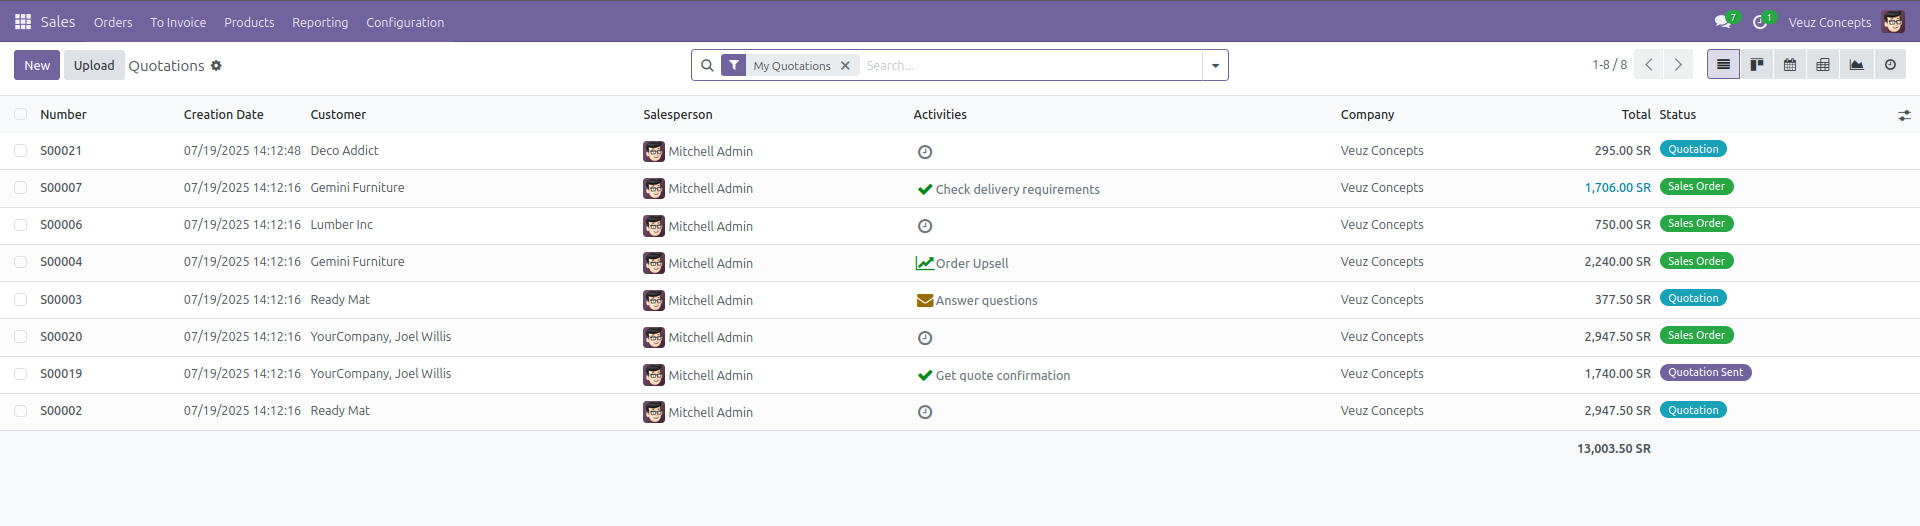
List View
The list view or tree view shows all the existing records in that model. The important information in those records will be shown in the list view.
Here is an example code of how to define a list view :
<odoo>
  <record id="view_tree_library_book" model="ir.ui.view">
    <field name="name">library.book.tree</field>
    <field name="model">library.book</field>
    <field name="arch" type="xml">
      <list string="Books">
        <field name="name"/>
        <field name="author"/>
        <field name="published_date"/>
        <field name="category_id"/>
      </list>
    </field>
  </record>
</odoo>
- Tree / List view is defined using the <list> </list> tag.
- string="Books": Sets the title of the tree view shown at the top.
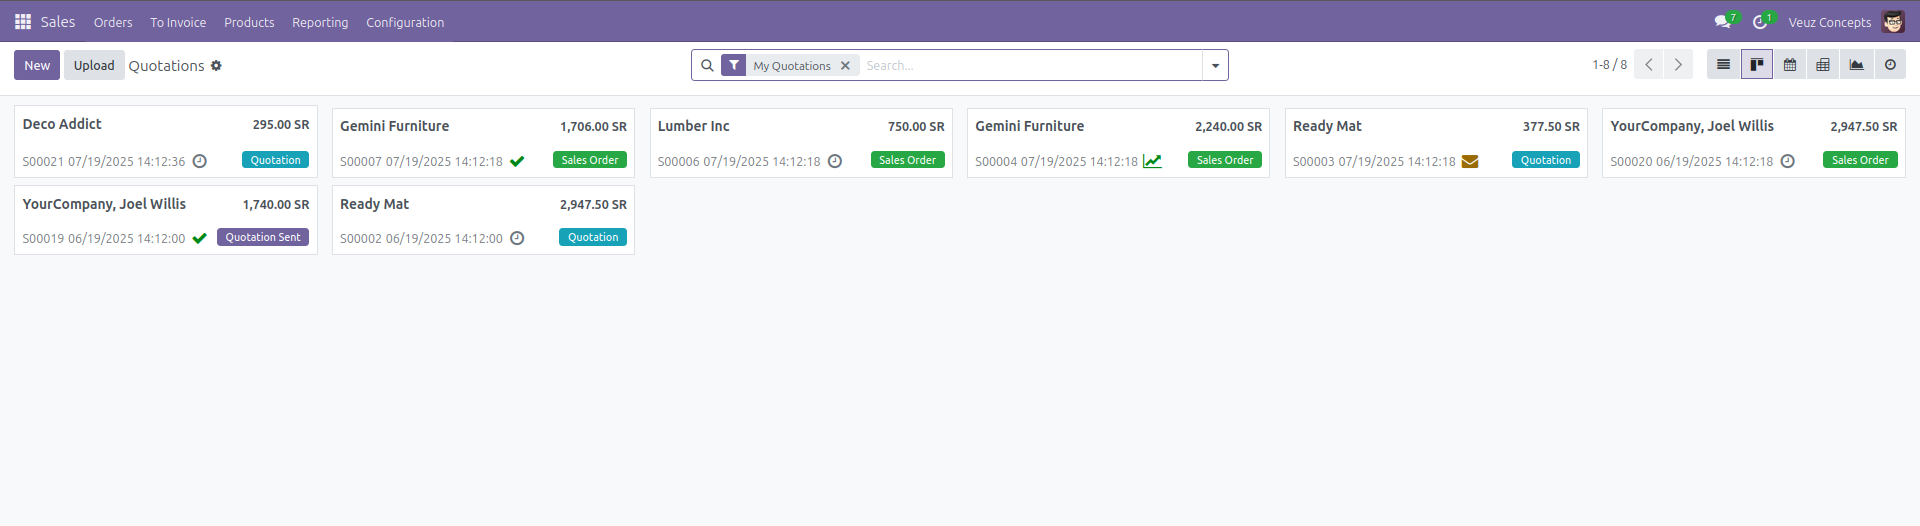
Kanban View
The Kanban view displays records as cards organized into columns. It is particularly useful for models where records need to be grouped by different states or stages.
Here is an example code of how to define a kanban view :
<odoo>
  <record id="view_kanban_library_book" model="ir.ui.view">
    <field name="name">library.book.kanban</field>
    <field name="model">library.book</field>
    <field name="arch" type="xml">
      <kanban class="o_kanban_example" string="Books">
        <templates>
          <t t-name="kanban-box">
            <div class="oe_kanban_card">
              <strong><field name="name"/></strong><br/>
              <field name="author"/><br/>
              <field name="published_date"/><br/>
              <field name="category_id"/>
            </div>
          </t>
        </templates>
      </kanban>
    </field>
  </record>
</odoo>
- Kanban view is defined by <kanban> </kanban> tag .
- kanban-box is the main template block rendered for every book.
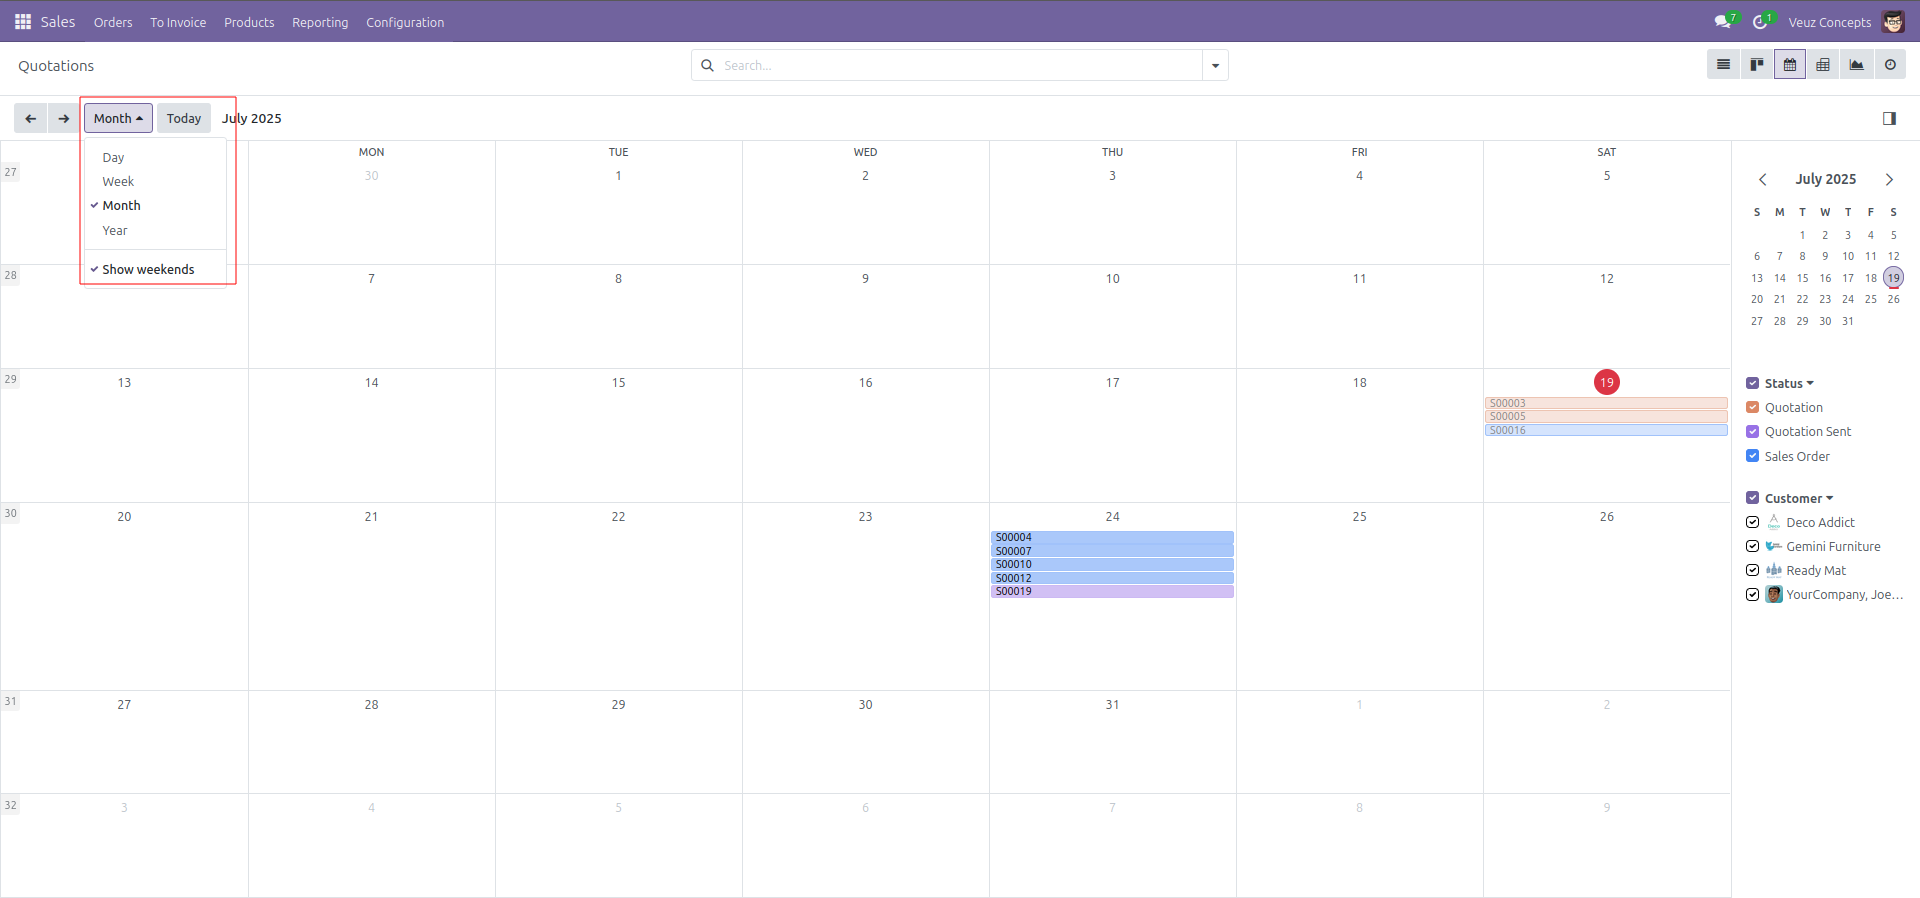
Calender View
The Calendar view displays records in the calendar as events on a daily, weekly, or monthly calendar. It is ideal for managing tasks, deadlines, and schedules efficiently.
Here is an example code of how to define a calender view :
<odoo>
  <record id="view_calendar_library_book" model="ir.ui.view">
    <field name="name">library.book.calendar</field>
    <field name="model">library.book</field>
    <field name="arch" type="xml">
      <calendar string="Book Publishing Calendar" date_start="published_date">
        <field name="name"/>
        <field name="author"/>
      </calendar>
    </field>
  </record>
</odoo>
- The calender view is defined using <calender> </calender> tag.
- date_start="published_date" tells Odoo which date field to use for positioning the records on the calendar.
- The fields defined are shown inside each calendar event card.
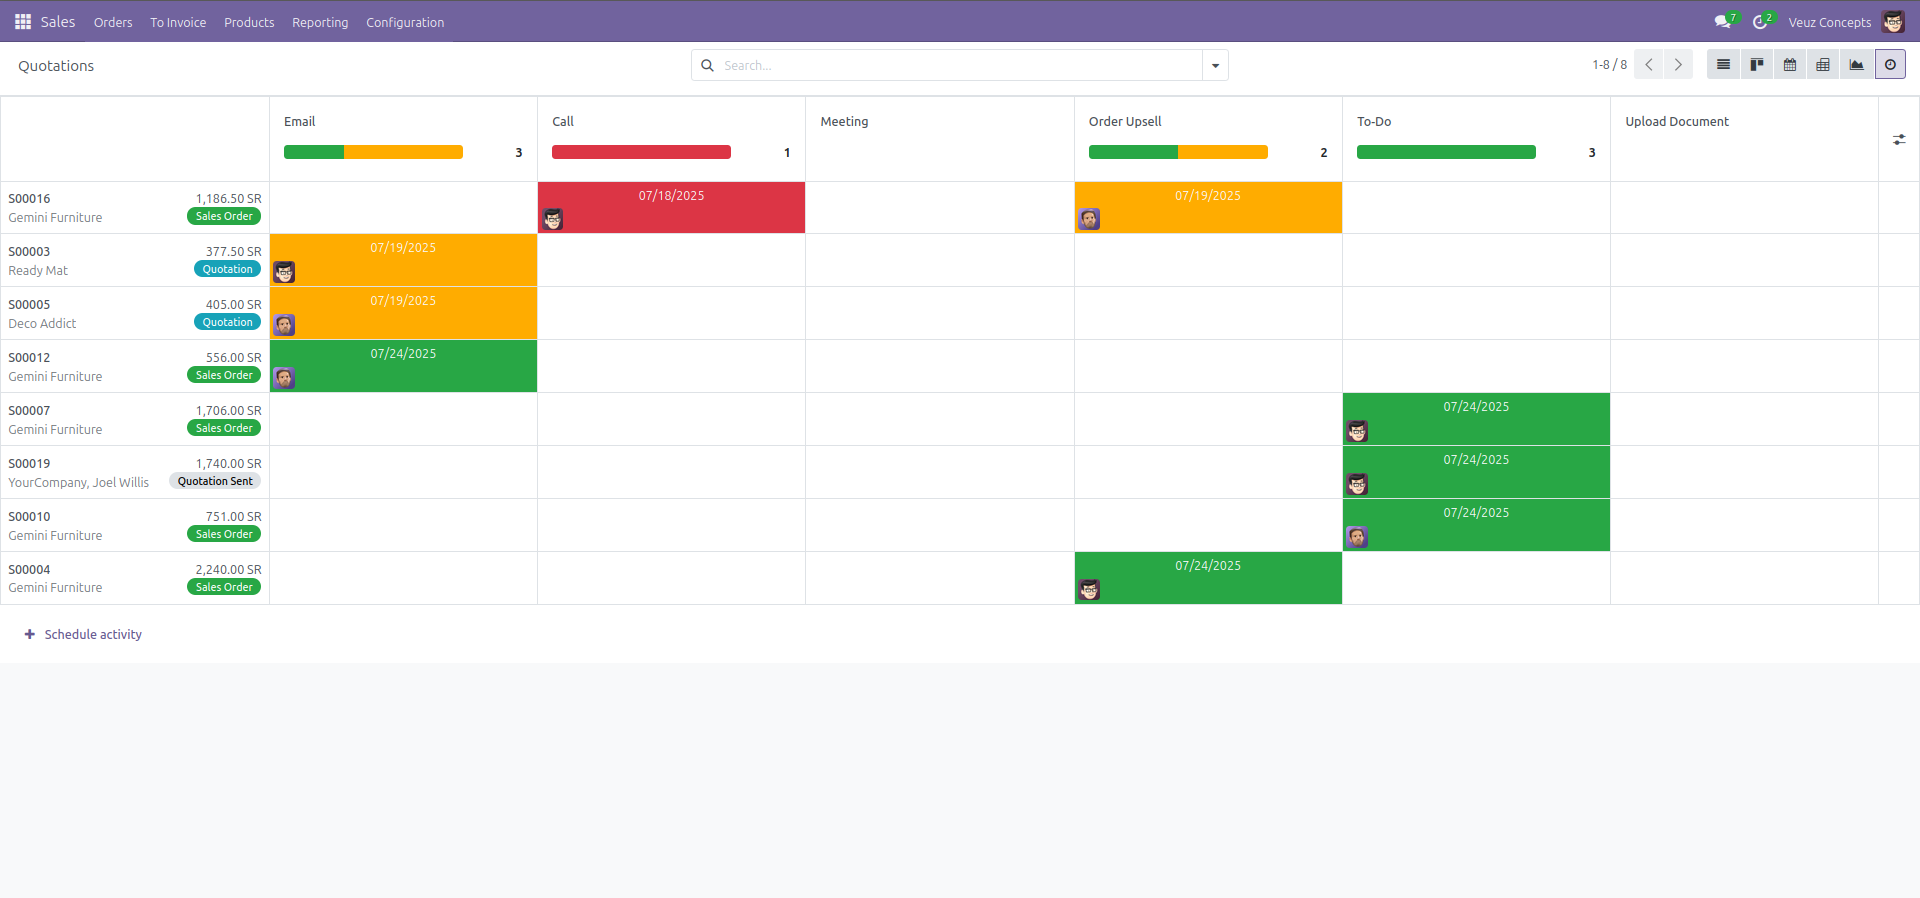
Activity View
The Activity View shows the activities assigned in each record. It helps in managing and scheduling calls, meetings, emails, etc. It displays activities with different color codes indicating their status—green for completed, red for overdue, and yellow for due today—making it easy to prioritize tasks at a glance.
Here is an example code of how to define a activity view :
<record id="library_book_view_activity" model="ir.ui.view">
    <field name="name">library.book.view.activity</field>
    <field name="model">library.book</field>
    <field name="arch" type="xml">
        <activity string="Book Activities">
            <templates>
                <div t-name="activity-box">
                    <field name="create_uid" widget="many2one_avatar_user"/>
                    <div class="flex-grow-1">
                        <field name="name" string="Book Title" class="o_text_block o_text_bold"/>
                        <field name="author"/>
                        <field name="published_date"/>
                    </div>
                </div>
            </templates>
        </activity>
    </field>
</record>
- The Activity view is defined using the <activity> </activity> tag.
- It allows you to see and manage scheduled activities (like To-Dos, Calls, Emails) on each book record.
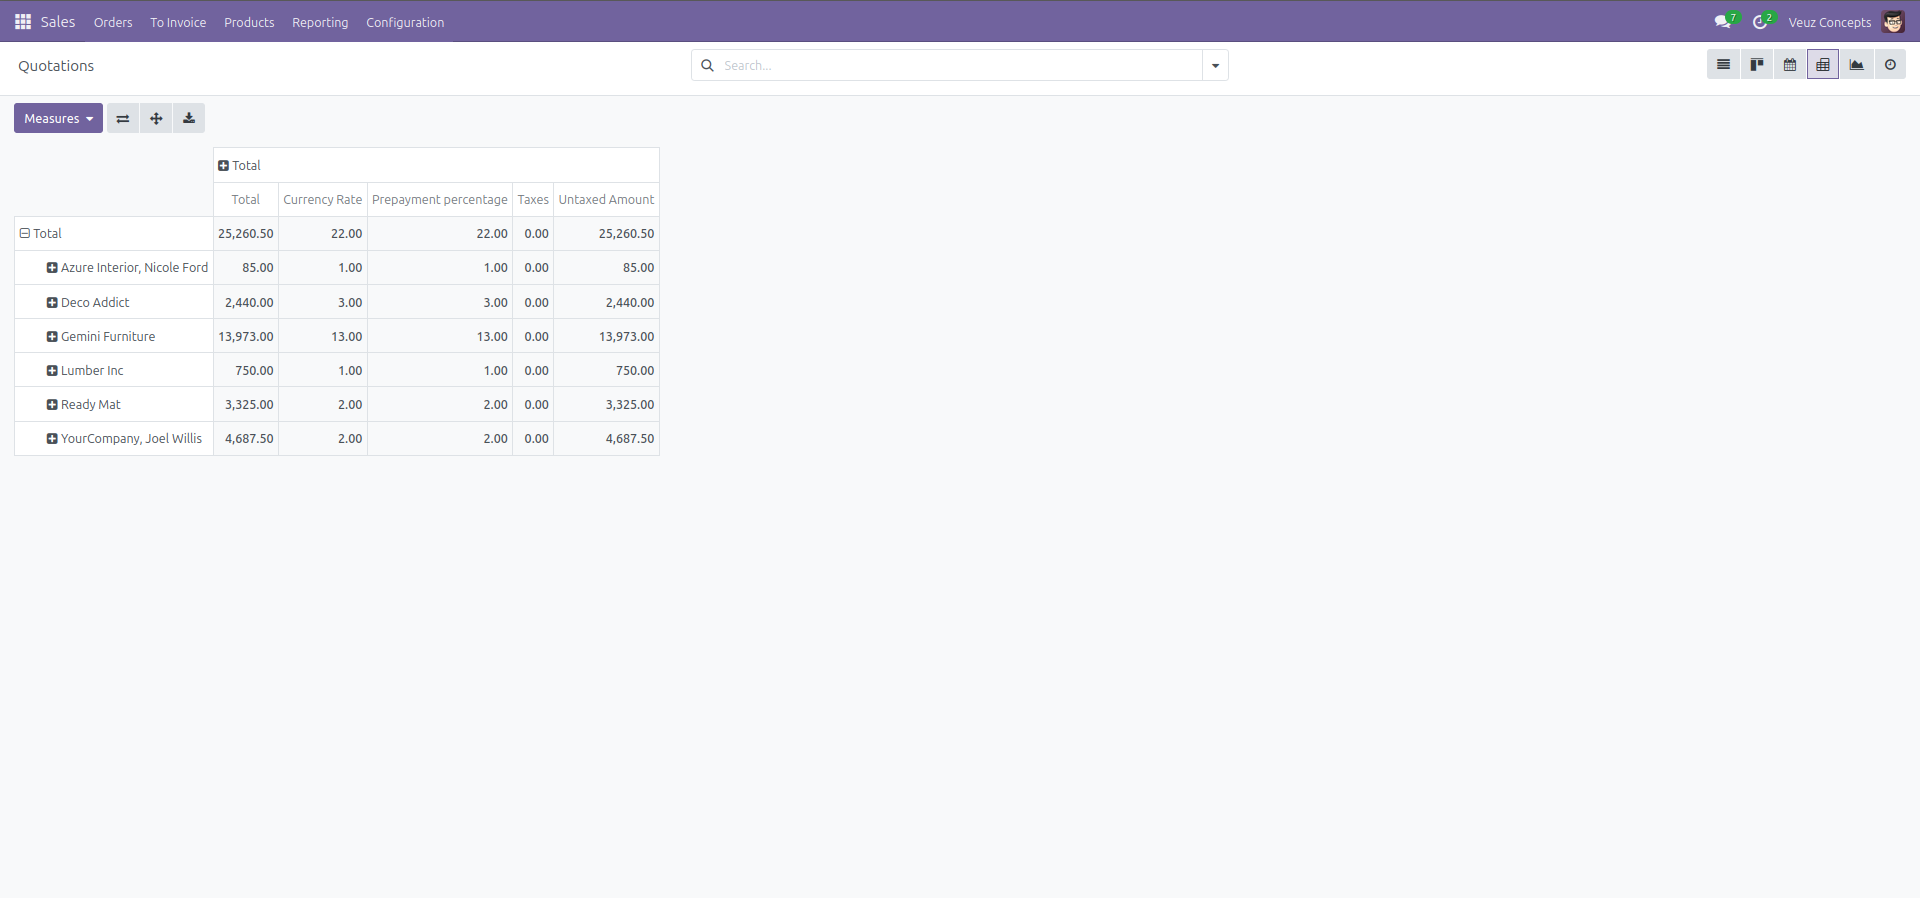
Pivot View
The Pivot view is used for data analysis, allowing users to create dynamic Excel reports with various filters and groupings.
Here is an example code of how to define a pivot view :
<odoo>
  <record id="library_book_view_pivot" model="ir.ui.view">
    <field name="name">library.book.view.pivot</field>
    <field name="model">library.book</field>
    <field name="arch" type="xml">
      <pivot string="Book Analysis">
        <field name="category_id" type="row"/>
        <field name="published_date" type="col"/>
        <field name="id" type="measure"/>
      </pivot>
    </field>
  </record>
</odoo>
- the Pivot view is defined using the <pivot> </pivot> tag.
- type="row" : Groups data by book category (rows).
- type="col" : Groups data by published date (columns).
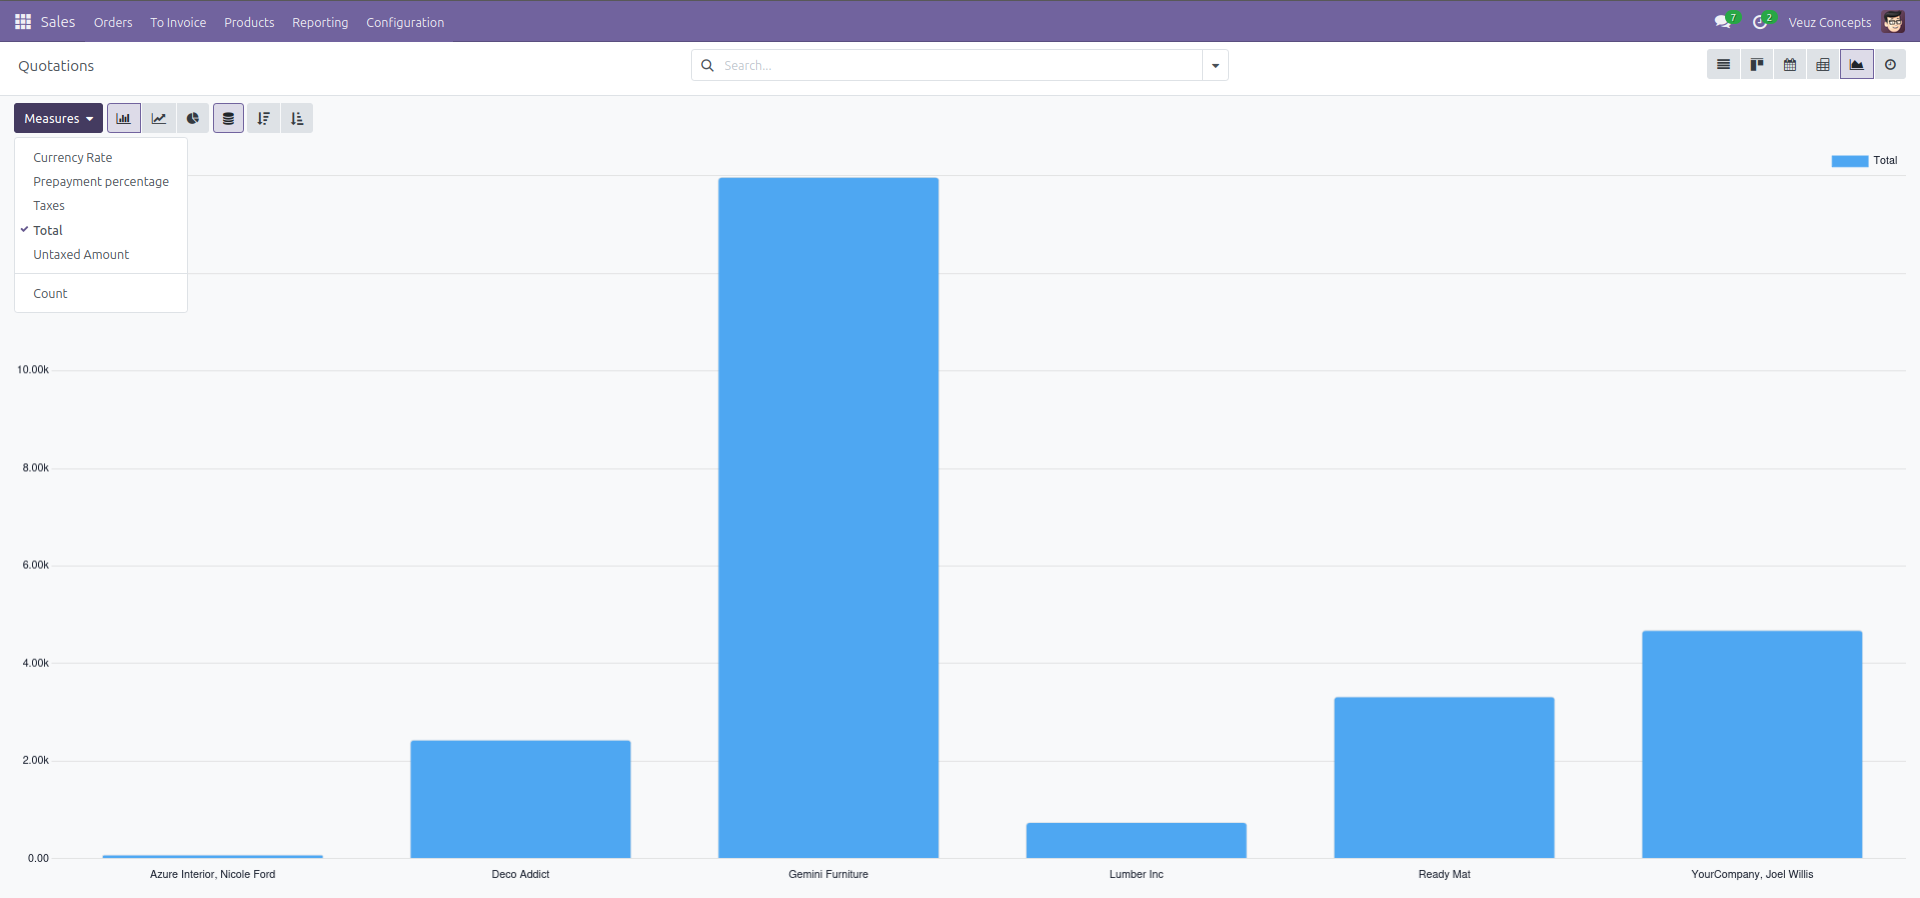
Graph View
The Graph view in Odoo provides visual insights into data using different chart types such as bar charts, line charts, and pie charts. It helps users easily interpret trends, comparisons, and summaries across various records.
Here is an example code of how to define a graph view :
<record id="view_sale_order_graph" model="ir.ui.view">
        <field name="name">sale.order.graph</field>
        <field name="model">sale.order</field>
        <field name="arch" type="xml">
            <graph string="Sales Orders" sample="1">
                <field name="partner_id"/>
                <field name="amount_total" type="measure"/>
            </graph>
        </field>
    </record>
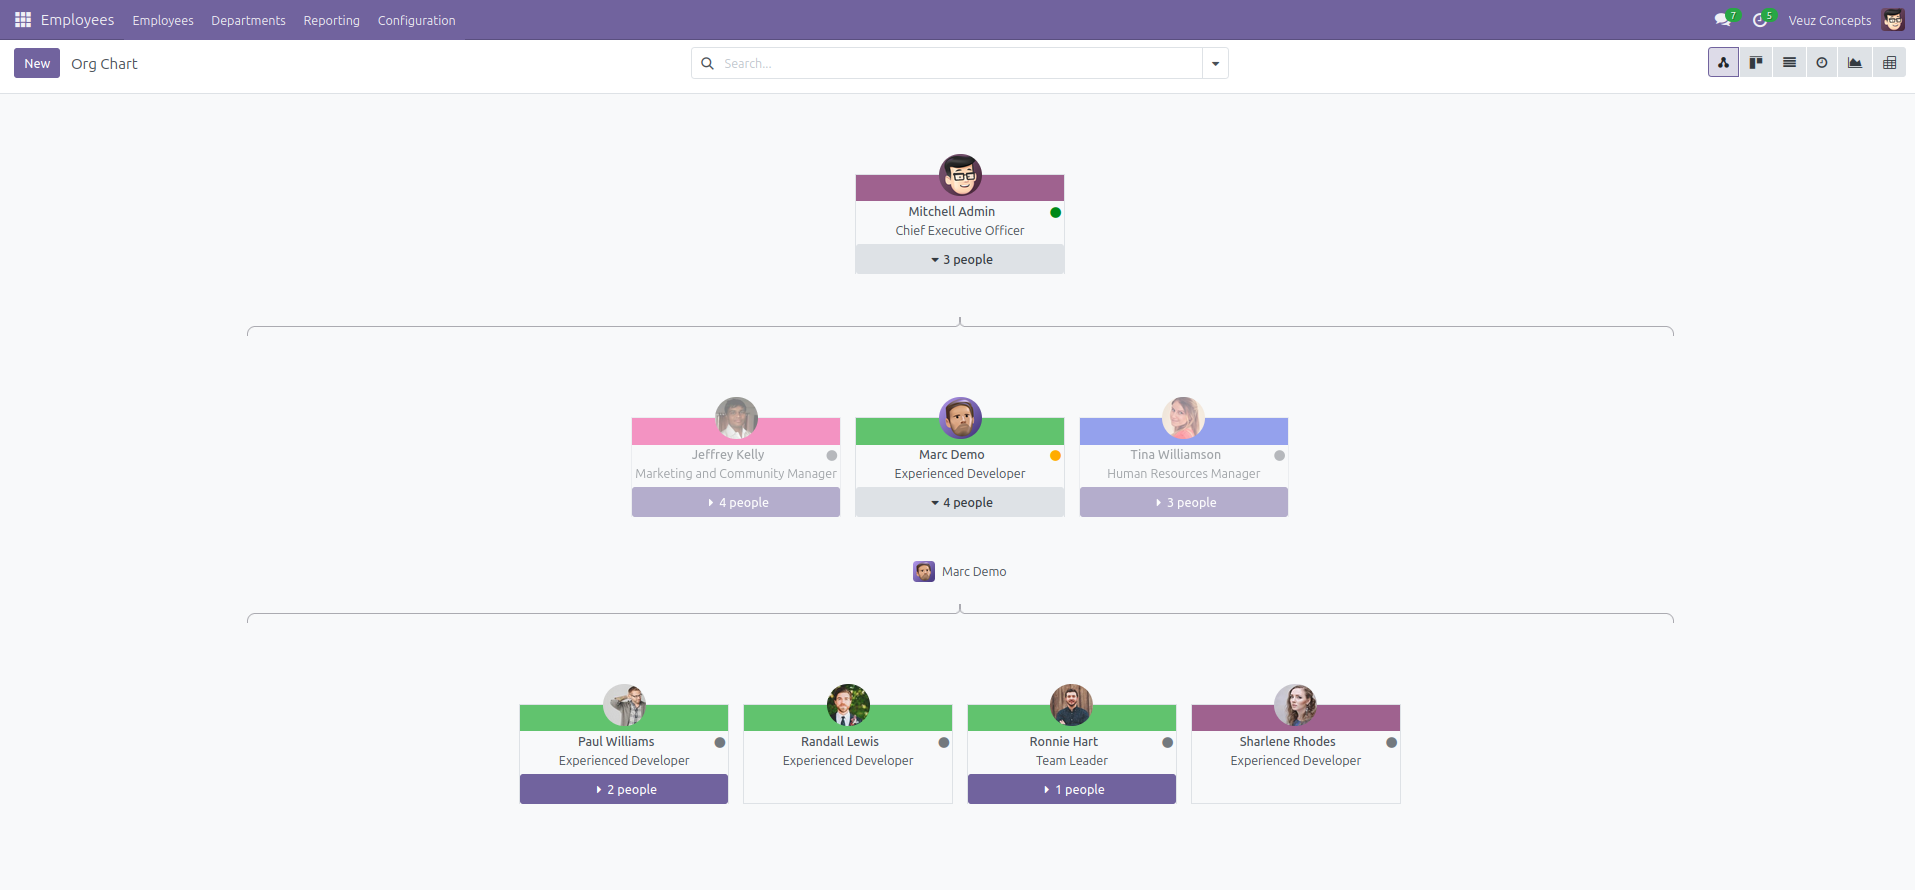
Hierarchy View
The Hierarchical View (also called the Gantt Hierarchy or Tree Structure View) in Odoo 18 allows users to visualize records with parent-child relationships in a collapsible tree format. This is useful for models like employees, chart of accounts, or projects where data is structured in a hierarchy. It is often used with models having parent_id field .
Here is an example code of how to define a hierarchy view :
<record id="hr_employee_hierarchy_view" model="ir.ui.view">
        <field name="name">hr.employee.view.hierarchy</field>
        <field name="model">hr.employee</field>
        <field name="arch" type="xml">
            <hierarchy child_field="child_ids" js_class="hr_employee_hierarchy" icon="fa-users" draggable="1">
                <field name="name" />
                <field name="job_id" />
                <field name="department_color" />
                <field name="hr_icon_display" />
                <field name="department_id" />
                <templates>
                    <t t-name="hierarchy-box">
                        <div t-attf-class="o_hierarchy_node_header d-flex justify-content-center pb-4 o_hierarchy_node_color_{{ record.department_color.raw_value }}"
                             t-att-title="record.department_id.value"
                        >
                            <field name="image_1024" preview_image="image_128" options="{'zoom': true, 'zoom_delay': 1000}" widget="background_image" />
                        </div>
                        <div class="d-flex flex-column text-center">
                            <div class="d-flex">
                                <field class="fw-bold w-100" name="name" />
                                <field name="hr_icon_display" class="flex-shrink-0" widget="hr_presence_status" />
                            </div>
                            <field name="job_title"/>
                        </div>
                    </t>
                </templates>
            </hierarchy>
        </field>
    </record>
- The Hierarchy view is defined using the <hierarchy> </hierarchy> tag.
- child_field="child_ids" : defines the child relationship (each employee's subordinates).
- js_class="hr_employee_hierarchy" assigns a JavaScript class for custom behavior/styling.
- draggable="1" allows drag-and-drop of nodes.


.jpg )


Leave a comment